


Client analytics reporting gets complicated when an agency tries to show everything. The client does not need a monthly screen share through every ad account, analytics tab, and spreadsheet. They need a clear answer to three questions: what changed, why it matters, and what the agency is doing next.
Simple reporting is not about hiding poor results. It is about putting the useful information first. A good report can show that traffic fell, that a landing page is losing mobile visitors, or that a campaign brought lower-quality sessions. The value comes from explaining the result accurately and turning it into a practical next action.
This guide explains how to make analytics reporting easier for ecommerce clients without turning every account into a separate manual project. It applies whether you use Page Pulse, Fathom, Plausible, Google Analytics, or a mix of tools.
Agree on the business outcome before you build the report
Start with the client’s actual goal. For one ecommerce store, the main outcome is orders and profitable revenue. For another, it may be qualified leads, completed financing applications, booked calls, or product-page engagement before a longer sales process. The report should follow the outcome, not the tool.
Write the definitions down at the start of the engagement. What counts as a lead? Which orders are included? How are returns handled in financial reporting? Which paid channels are in scope? This prevents a familiar problem where the client, ad manager, and analyst all use the word “conversion” to mean something different.
Keep the primary metrics small. A typical ecommerce report can start with revenue or qualified leads, conversion rate, relevant traffic, and one or two supporting signals such as add to cart or checkout start. The supporting signals are there to help explain what happened, not to fill the page.
Use a consistent reporting structure
A consistent layout makes clients more comfortable because they know where to look. Begin with a short summary in plain language. Then show the key outcome, the main driver of change, and the next action. Details can sit below that for clients who want to inspect them, but the first view should make sense without an analytics background.
For example, a useful summary might say that paid traffic increased but purchase rate fell because a new campaign sent visitors to a broad collection page. The proposed next action is to direct the campaign to a more relevant product page and compare checkout starts. That is clear, specific, and connected to the business.
A weak summary says that sessions went up 18 percent, engagement rate moved, and the dashboard has several interesting insights. That leaves the client to decide whether the result is good or bad. The agency should do the work of turning numbers into a recommendation.
Choose the simplest reporting stack that fits the client
A client-facing dashboard should be easy to understand and easy to maintain. The current Page Pulse overview describes a workspace with traffic, conversions, clicks, heatmaps, and team context. That can be a useful option when an agency wants to bring basic website performance and behavior clues closer together.
For clients who care strongly about privacy-first web analytics, the current Plausible documentation describes reporting, conversion goals, ecommerce revenue tracking, and team features in a focused dashboard. The exact tool matters less than the role it plays. The agency needs one reliable place for the core website story.
Fathom is another option when a client needs an accessible reporting view. Its current feature page includes dashboard metrics, events, UTM reporting, sharing, email reports, and multi-site views. That can fit an agency with several client sites, especially if a simple recurring report is more useful than a custom analytics project for each account.
Use Page Pulse when the client benefits from seeing traffic, conversions, clicks, and behavior context together.
Use Plausible when a privacy-focused web analytics dashboard is the clearest match for the account.
Use Fathom Analytics when simple recurring reporting, sharing, or multi-site visibility is the important need. In every case, give the client one primary recurring report. Do not create three dashboards that all show slightly different totals.
Separate acquisition, on-site behavior, and financial results
Clients often receive data from several systems that answer different questions. The ad platform describes delivery and platform-reported results. Web analytics describes what happened after a click. The commerce platform and finance records describe actual orders and revenue. Those sources may not match exactly, and that does not automatically mean one is broken.
Explain the role of each source in the report. Use financial records for business results. Use web analytics for traffic and conversion patterns. Use advertising platforms for campaign delivery and optimisation context. When the numbers differ, investigate the reason instead of silently choosing the most flattering total.
Behavior tools have a separate role. Heatmaps and recordings can help investigate a weak page or confusing path, but they should not become a routine monthly attachment. Include behavior evidence when it supports a decision. A screenshot without a clear implication adds noise rather than clarity.
Build a short monthly narrative
Every monthly report should tell a short, honest story. Begin with the outcome compared with the previous relevant period. Then explain the largest driver of change. Finally, state the action being taken. If the result is positive, explain what the team wants to continue or test further. If the result is negative, explain what was learned and what will change.
Do not force a positive story when the numbers are weak. Clients usually respect a clear explanation more than a report that tries to decorate a problem. For example, if conversion dropped after a product went out of stock, say that. If a new campaign brought cheaper clicks but weaker buyers, say that too. The goal is to make a better decision, not to win the report.
Use context so the client can understand the movement. Note a major promotion, site change, stock issue, campaign launch, seasonality, shipping disruption, or change to the offer. A short change log is often more valuable than another visualisation because it explains why the dashboard may have moved.
Set a reporting cadence that matches the account
Weekly reporting is useful when a client is spending actively, running a launch, or testing important landing pages. Monthly reporting may be enough for a stable store with lower traffic. The right cadence depends on how quickly the team can act on the information. Reporting every day is not helpful if no one can make a meaningful change until the end of the month.
Separate the regular report from the strategic conversation. A weekly note can be short: outcome, change, action. A monthly or quarterly review can go deeper into channel mix, product trends, customer questions, landing-page performance, and the tests that influenced results. This keeps routine reporting from becoming a long meeting every week.
Give each report an owner on both sides. The agency owner prepares the narrative and recommendation. The client owner provides context about inventory, promotions, business priorities, and operational issues. Analytics works better when the client is not treated as a passive reader of a dashboard.
Use a simple client-reporting template
The first section is the headline result. State the main commercial metric and the comparison period. The second section is what drove the change. Name the relevant channel, page, product category, or operational event. The third is the action. Say what will happen before the next report and what metric will show whether the action helped.
The next section can be a short table for clients who need more detail. Include the key outcomes, relevant traffic sources, and one supporting conversion step. Avoid listing metrics just because the dashboard provides them. If a metric does not change a decision, it usually does not belong in the client-facing section.
Finish with open questions or client actions. The agency may need an updated product feed, a shipping policy clarification, a new creative asset, confirmation of stock levels, or approval for a landing-page test. Giving the client a clear next task makes the report part of the operating process instead of a retrospective document.
Common reporting mistakes to avoid
The first mistake is hiding a result behind jargon. Write as if the client is busy and intelligent but does not spend their day in analytics. The second is using an inconsistent date range. Compare like with like where possible, especially around promotions and seasonal periods.
The third is confusing attribution with accounting. An ad platform can report a conversion that does not line up exactly with the store’s revenue records. Explain the difference rather than arguing about which platform “wins.” Your client needs a reliable operating view, not a theoretical perfect match across all systems.
The fourth is reporting without a recommendation. If the agency does not know what to do next, say what needs more investigation. A clear unanswered question is better than a confident but unsupported claim. The report should move the work forward.
Examples of clear client reporting
A paid-traffic ecommerce account
Imagine a furniture store that spends steadily on paid search and social campaigns. The monthly report should begin with the commercial outcome, not the channel-specific clicks. State the revenue or qualified orders, then describe the most important change in traffic quality or landing-page performance. If paid search brought more sessions but fewer product-page clicks, that is the story the client needs to understand.
The next action should be visible. The agency may decide to send one campaign to a more specific collection, improve the first screen of a product landing page, or pause a keyword group that attracts irrelevant research traffic. The client should be able to read the report and understand what will change without opening any separate dashboard.
A high-ticket lead-generation account
For a higher-consideration product, a completed order may not be the immediate outcome. The report may need to focus on qualified form submissions, booked calls, finance applications, or conversations that reach the sales team. Be specific about the difference between a raw form completion and a qualified lead. That distinction protects the agency and client from celebrating volume that does not produce revenue.
Use the report to explain the quality of the lead path. A campaign may produce fewer form submissions but more qualified conversations because the landing page now makes the product requirements clearer. That can be a better business result. The narrative needs to connect the traffic, the page, and the sales feedback rather than treating each number as a separate win or loss.
An account with a seasonal swing
Some ecommerce categories move sharply because of weather, holidays, industry cycles, or inventory availability. A simple month-over-month comparison can make a normal seasonal drop look alarming. Give the client enough context to understand whether the change reflects a real performance issue or a predictable part of the market.
Compare similar periods where possible. Note promotions, price changes, stockouts, and delivery constraints. If a client had a best-selling item unavailable for ten days, place that fact next to the revenue movement. Analytics is more useful when it reflects the operation of the business, not just the traffic that was visible to the ad account.
An account with a weak landing page
When a page is leaking visitors, keep the client report focused on the evidence and the test. Say which page is underperforming, which visitor segment is affected, and what the agency observed. The observation could be that mobile paid traffic reaches the page but rarely progresses to the product or form step.
Then propose one change. Improve the message match, move delivery information higher, make the relevant product easier to find, or simplify the first form. Report back on what happened after the test. This demonstrates a disciplined optimisation process instead of turning a client update into a list of design opinions.
How to manage the report-production process
Build the report from a repeatable checklist. Pull the primary business outcome from the agreed system of record. Check the core web analytics view. Review active campaigns and major site changes. Ask the client about inventory, promotions, and operational issues. Draft the summary before filling in extra detail. This order keeps the work centred on the story rather than the screenshots.
Create a short internal note for each account. Include metric definitions, the reporting time zone, the primary data sources, campaign naming rules, current business priorities, and open questions. This reduces errors when someone else needs to prepare the report. It also keeps the agency from reinventing the process every month.
Use automation only where it makes the report more reliable. Automatic data collection is useful. Automatic explanations can be risky when they ignore an offer change or stock problem. Keep a human review between the dashboard and the client. The final report should reflect what the agency knows about the account, not just what a tool can summarise.
Finally, measure whether reporting is helping the relationship. Are clients coming to meetings with better questions? Are actions being approved more quickly? Are the same data disputes happening every month? If the report is clear but no action follows, revisit the format and the account priorities. Good reporting is a decision system, not a document production exercise.
How this supports ecommerce clients
Reporting becomes much easier when the underlying business is healthy. If your client is building a high-ticket store, point them first toward the high-ticket dropshipping overview so marketing work stays connected to the business model.
Category and supplier work matter before an agency spends heavily on traffic. The high-ticket niche research list helps frame product selection. The supplier research guide helps make sure the business can deliver what the campaigns promise.
The client also needs solid operating foundations. Share the business formation checklist when relevant. More practical ecommerce guides are available at E-Commerce Paradise.
Frequently Asked Questions
What should an agency analytics report include?
Include the main business outcome, the most relevant traffic and conversion context, the biggest driver of change, and the next action. Keep the first view short enough for the client to understand quickly.
How often should agencies send analytics reports?
Weekly is useful during active campaigns or launches. Monthly is often enough for stable accounts. Match the cadence to how quickly the team can act on the information.
Why do ad-platform and website analytics numbers differ?
They use different attribution methods, time zones, tracking rules, and conversion definitions. Explain which source is used for which decision instead of expecting every total to match exactly.
Should clients get access to every analytics dashboard?
Not necessarily. Give access when it helps, but make the recurring report clear on its own. Too many dashboards can create more confusion than transparency.
How do I report bad performance to a client?
Be direct. State the result, the likely drivers, what has been checked, and what the agency will test next. A clear plan is more valuable than trying to make a weak result sound positive.
Keep researching
- Page Pulse review for ecommerce teams
- Simple website analytics tools for ecommerce
- How to find landing page conversion leaks
- Page Pulse vs Plausible
- Page Pulse vs Google Analytics

Trevor Fenner is an ecommerce entrepreneur and the founder of Ecommerce Paradise, a platform focused on helping entrepreneurs build and scale profitable high-ticket ecommerce and dropshipping businesses. With over a decade of hands-on experience, Trevor specializes in high-ticket dropshipping strategy, niche and product selection, supplier recruiting and onboarding, Google & Bing Shopping ads, ecommerce SEO, and systems-driven automation and scaling. Through Ecommerce Paradise, he provides free education via in-depth guides like How to Start High-Ticket Dropshipping, advanced training through the High-Ticket Dropshipping Masterclass, and fully done-for-you turnkey ecommerce services for entrepreneurs who want a faster, more hands-off path to growth. Trevor is known for emphasizing sustainable, real-world ecommerce models over hype-driven tactics, helping store owners build scalable, sellable, and location-independent brands.
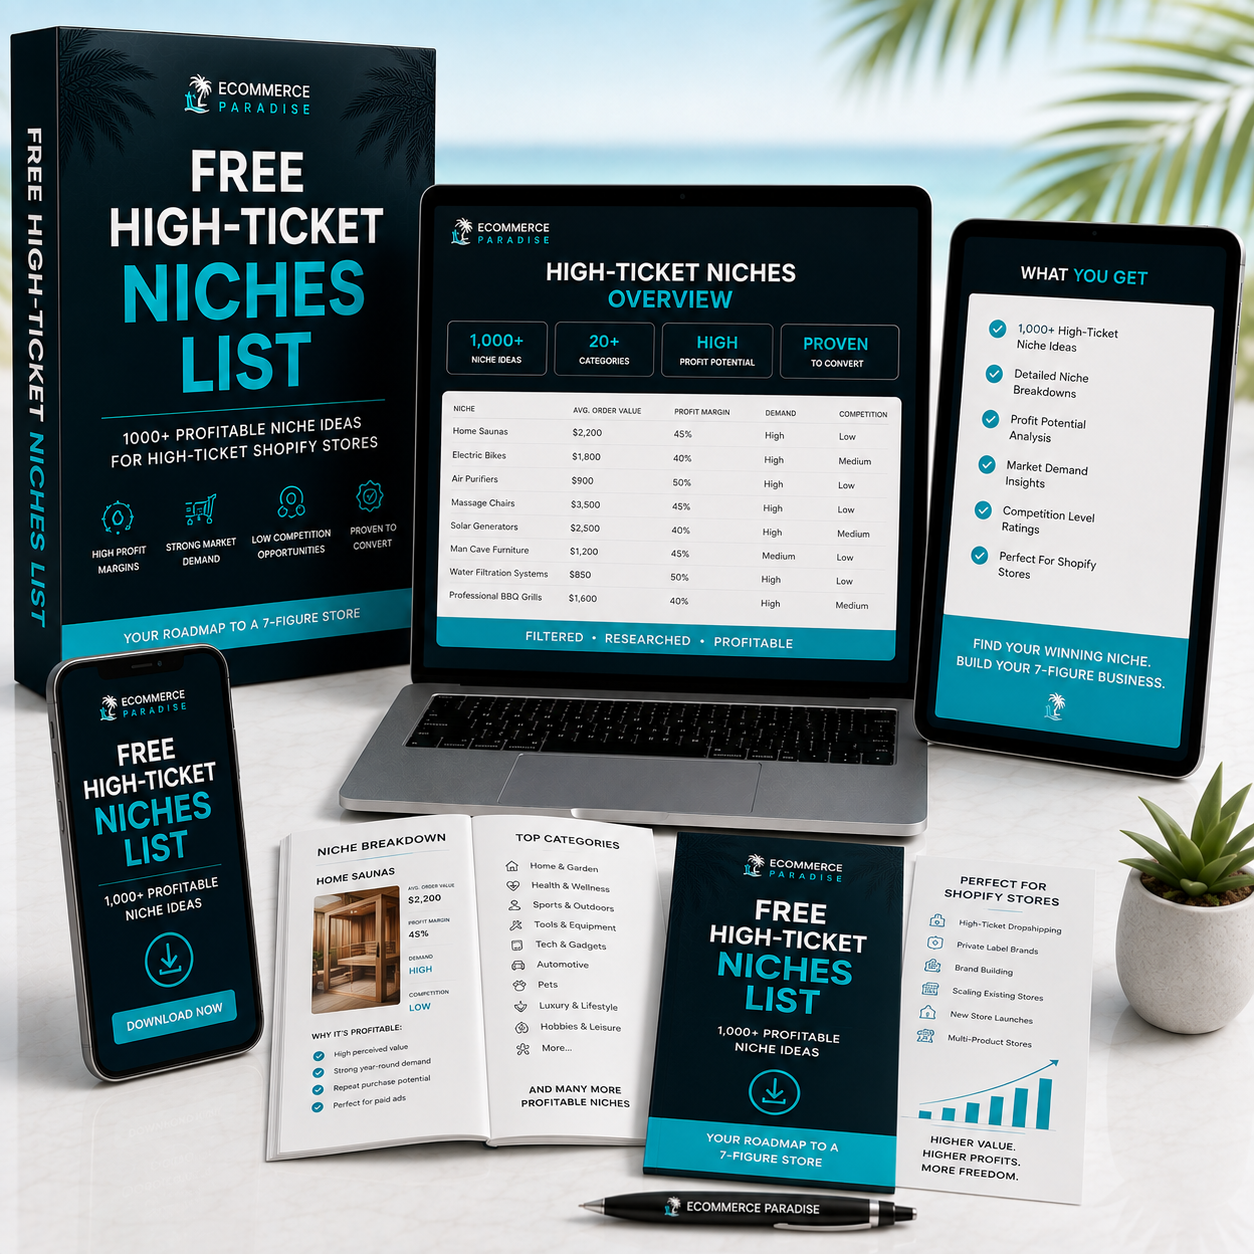
Still deciding what to sell?
Grab the free list of 1,000+ niches that work for high-ticket dropshipping, sorted by category.
Free. Unsubscribe any time.


