


If you’re evaluating Piktochart in 2026 as a visual content creation tool for your ecommerce business, marketing operations, or content marketing strategy, this review breaks down everything you need to know to decide whether the platform fits your operational needs or whether a more general design tool like Canva or a specialized data visualization platform like Visme would deliver better results. Piktochart positions itself specifically as a visual communication platform built around infographics, data-driven presentations, reports with charts, and explainer graphics, with AI-powered text-to-infographic and text-to-report features that genuinely save time when you’re translating complex data into shareable visual content. Piktochart gives two different user counts on its own pages: the homepage says 34 million and the login screen at create.piktochart.com says over 38 million. Pricing starts at free, then $10/month billed annually ($120/year) for Pro, $17/month billed annually ($204/year) for Business, and custom pricing for Enterprise.
I’ve been running and consulting on ecommerce stores since 2013, and I teach this at Ecommerce Paradise. Working with coaching students is where most of these tool questions come up, and the answer usually depends on business stage rather than feature lists. Piktochart comes up specifically for content marketers and bloggers who need to create infographics for SEO content, data visualizations for blog posts, lead magnet graphics, and visual reports for client communications. The honest answer is that Piktochart is genuinely good at what it specializes in (data-driven visual content) but isn’t the right tool for everyday graphic design work where Canva or VistaCreate deliver better value. The platform’s strength is data visualization and infographic creation; its weakness is that the Pro tier exports PNG only, so the plan most people buy cannot produce a PDF.
This review covers Piktochart’s complete 2026 pricing across all seven plan cards it publishes (Free, Pro, Business, Enterprise, Education, Campus and Nonprofit), the platform’s actual feature depth across infographics, presentations, reports, and videos, the AI features added in 2024-2025, real cost math comparing Piktochart against Canva, Visme, and other alternatives, support quality and operational realities, real operator profile recommendations for ecommerce content marketers, and the migration considerations if you’re switching from a competitor.
Try Piktochart Free
Visual content creation platform for infographics, data-driven presentations, reports, and explainer graphics. AI text-to-infographic and text-to-report features. Piktochart’s homepage says 34 million users worldwide. Free plan available with 2 PNG downloads; Pro from $10/month billed annually.
Piktochart at a Glance
What Piktochart is: Cloud-based visual content creation platform specializing in infographics, data-driven presentations, reports with charts, social media graphics, posters, flyers, and explainer videos. Founded in 2011 in Penang, Malaysia. User count depends on which Piktochart page you read: the homepage says 34 million users worldwide and 220 million visuals created, while the login screen at create.piktochart.com says over 38 million people. Both figures are the company’s own.
Who it’s for: Content marketers creating infographics for SEO content, data visualization, and lead magnets. Educators producing visual learning materials and reports. HR teams creating internal communications and onboarding visuals. Nonprofit organizations producing impact reports and donor communications. Marketing analysts translating complex data into digestible visual content. Small businesses without dedicated designers needing professional-quality visual content. Bloggers wanting to add visual depth to written content for SEO and social sharing.
Who it’s not for: Daily social media content creators (Canva or VistaCreate deliver better value for high-volume social design work). Professional graphic designers needing advanced design control (Adobe Creative Suite or Figma deliver more capability). Operators primarily creating static product images or thumbnails (general-purpose tools cost less). Teams needing API access for programmatic design generation (Piktochart has no API). International businesses requiring multi-language platform interfaces (English only).
Core pricing: Free plan publishes 2 PNG downloads, 1GB storage and 60 AI credits, and Piktochart’s own comparison table shows no Piktochart logo on downloads at every tier including Free. Pro at $10/month billed annually ($120/year) or $15/month billed monthly delivers unlimited PNG downloads, premium templates and 100GB storage, but exports PNG only. Business at $17/month billed annually ($204/year) or $20/month billed monthly is the first tier with PDF and PowerPoint export, and the only tier with brand colors, fonts and logos. Enterprise is custom-quoted with personalized onboarding, enterprise security and SSO. Education is $39.99/year and Nonprofit is $60/year, both requiring verification.
Key differentiators: AI text-to-infographic and text-to-report features that no general design tool matches. Specialized templates for infographics and data visualization that Canva and similar tools don’t optimize for. A large user base with proven adoption across marketing, education, and nonprofit sectors, though the company gives two different counts of it on its own pages. Drag-and-drop interface accessible to non-designers. PowerPoint export functionality for presentation workflows. Strong template library specifically designed for data storytelling. An education plan at $39.99 per member per year makes the platform genuinely affordable for verified students and educators.
Piktochart Pricing Breakdown for 2026
Free Plan ($0): Piktochart’s pricing page publishes 2 PNG downloads, unlimited visual projects, 60 AI credits, free templates only and 1GB storage. The page does not state whether those 2 downloads reset monthly, annually or at all, so plan against the floor and assume they may not come back. Maximum 4-member team workspace (1 owner plus 3 members). PNG is the only export format on Free. On the watermark question, Piktochart’s own full feature comparison has a row titled “No Piktochart Logo on Downloads” that carries a green tick in all five columns including Free, and the Download Quality row reads Normal, Medium, High for every tier including Free. That is the vendor’s published claim rather than a test result, so export one file to confirm it before relying on it.
Pro Plan ($10/month billed annually or $15/month billed monthly): $120 per year on annual billing or $180 per year on monthly billing, which is the 33% saving Piktochart badges on the card. Unlimited PNG downloads, and PNG is the only format: the comparison table gives Download Formats as PNG for Pro, with PDF and PowerPoint starting at Business. Premium template library, 5M+ premium icons and illustrations, transparent background downloads, 500 AI credits and 100GB storage. Brand colors and fonts are not included on Pro; the comparison table marks them as unavailable until Business. Pro is the entry point for any serious individual creator using Piktochart for ongoing content production.
Business Plan ($17/month billed annually or $20/month billed monthly per member): $204 per year on annual billing or $240 per year on monthly billing per member, a 15% saving on annual. This is the first tier that exports PDF and PowerPoint, which for most buyers is the real reason to be here. All Pro features plus unlimited brand color schemes, custom fonts and logos, branded templates, 1,000 AI credits and 250GB storage. Business is appropriate for marketing teams and agencies producing branded content at scale where the brand kit features deliver value.
How team pricing works: Piktochart prices per person, and its pricing FAQ states “All prices are per account member.” so a second seat is a second subscription rather than a small add-on. Two seats on Pro billed annually is $240 per year and two seats on Business billed annually is $408 per year. The company publishes no volume-discount table for Piktochart team plans on its pricing page, so treat the per-seat rate as the rate at any size below Enterprise.
Enterprise Plan (Custom Pricing): Includes everything in Business plus enterprise-grade security (SSO, advanced compliance), more members and permissions options, personalized onboarding program, dedicated account manager, custom training, and SSO/SAML. Piktochart publishes no Enterprise price at all, so the only way to get a number is to ask their sales team. The plan card is aimed at workspaces of 101 or more members. Appropriate for large enterprise teams and educational institutions deploying Piktochart at organizational scale.
Education Plan ($39.99/year): Piktochart’s FAQ calls this “a 76% discount from our annual pricing”, but that percentage does not reconcile with the $120 Pro price published on the same page, where $39.99 is 66.7% off. Both stated discounts on that page only work against a $168 Pro price that is no longer published as a plan price. Use the dollar figure, not the percentage. The education tier exports PNG, PDF and PowerPoint, which Pro at $120 does not. Requires verification of educational status (.edu email or institutional verification). For schools and universities, the Piktochart Campus plan offers institution-wide licensing with custom pricing. The educational pricing is genuinely generous and makes the platform accessible for academic use.
Annual versus monthly billing: Piktochart’s pricing page says “Save up to 33% each year with an annual subscription”, and the badges check out. Pro saves $60 a year ($180 monthly against $120 annual, which is 33.3%). Business saves $36 a year ($240 against $204, which is exactly 15%). Only Pro saves a third, so the “up to” is doing real work. Refunds are close to unavailable: the Terms of Use say “We are unable to provide refunds of any fees already paid, including but not limited to cancellations, accidental purchases, mistakes made by You, or a change of mind.”
According to Piktochart’s official pricing page, paid tiers include unlimited downloads and annual billing saves up to 33%. The same page lists seven plan cards: Free, Pro, Business, Enterprise, Education, Campus and Nonprofit. For the full tier-by-tier breakdown with the real annual totals, the per-seat math and what happens to your designs if you cancel, see our Piktochart pricing guide.
Piktochart Core Features Reviewed
Infographic builder: This is Piktochart’s flagship feature and where the platform genuinely excels. Drag-and-drop editor with thousands of customizable infographic templates organized by use case (data, comparison, process, statistics, timeline). Built-in icon library with thousands of vector graphics. Stock photo integration through Unsplash and similar services. Custom illustrations and shapes. Chart and graph integration with real-time data binding. Smart object alignment and grid systems. Honest assessment: Piktochart’s infographic creation is genuinely better than Canva or VistaCreate for data-heavy content because the templates are specifically designed for information density rather than aesthetic appeal. For data storytelling, statistics presentations, and complex information visualization, Piktochart delivers professional results faster than general-purpose design tools.
Data visualization and charts: Built-in chart and graph types including bar charts, line charts, pie charts, donut charts, area charts, scatter plots, bubble charts, gauges, and progress bars. Data import from CSV, Excel, and Google Sheets with auto-update capability. Customizable colors, labels, and styling. Animation support for presentation contexts. Honest assessment: Chart capabilities are functional and adequate for most marketing use cases but lack the depth of specialized tools like Tableau or Power BI. Multiple users report that chart label customization is limited and labels can overlap on dense datasets, which is a meaningful limitation for serious data analysis workflows. For typical marketing infographics with simple chart needs, Piktochart works well; for sophisticated data visualization, dedicated tools deliver better results.
Presentation builder: Slide-based presentation creation with drag-and-drop editor. PowerPoint export functionality for delivery in standard presentation environments. Animation and transition support. Speaker notes integration. Custom presentation templates organized by use case. Brand kit integration for consistent slide design across decks. Honest assessment: presentations are a strong use case, with the caveat that PowerPoint export requires the Business tier and is not available on Free or Pro. The presentation experience is solid for data-heavy decks and information-dense slides. For creative or sales-heavy presentations where visual aesthetics matter more than data clarity, Canva or PowerPoint with creative templates often deliver better results.
Report builder: Multi-page report creation with consistent design system across pages. Cover page, executive summary, detailed sections, and appendix templates. Page numbering, headers, footers, and table of contents. PDF export with high quality, on the Business tier and above only. AI text-to-report feature that generates report drafts from prompts. Honest assessment: Report functionality is genuinely useful and saves significant time versus creating reports in Word or Google Docs. The AI text-to-report feature is one of Piktochart‘s most differentiated capabilities and produces credible first drafts that require editing rather than rewriting. For marketing reports, internal communications, and stakeholder updates, the report builder delivers strong value.
Video and animation: Animated infographic creation with timeline-based editor. Pre-designed animations for elements. Voiceover and music integration. MP4 export for sharing on social media or video platforms. Honest assessment: Video features are competent but not category-leading. For animated explainer content, dedicated tools like Animaker, Vyond, or Doodly deliver more sophisticated results. For simple animated infographics suitable for social media engagement, Piktochart works adequately. The video capability is a nice-to-have rather than a primary use case.
AI features: AI text-to-infographic generates infographic drafts from prompts and pasted text. AI text-to-report converts written content into formatted report layouts. AI design suggestions during editing. Smart template recommendations based on content type. Honest assessment: The AI features are Piktochart‘s most genuinely differentiated capability versus general design tools. The text-to-infographic feature in particular saves significant time when translating data or written content into visual format. The AI doesn’t replace design judgment; it produces reasonable starting points that benefit from human refinement. For content marketers translating blog posts or data into visual format, the AI features deliver real productivity gains.
Brand kit and customization: Brand colors, fonts, and logos saved for consistent application across designs. Color extraction from uploaded images or logos. Template customization to match brand guidelines. Honest assessment: brand kit functionality is solid, but read the tier carefully before you buy on the strength of it. Piktochart’s own comparison table marks “Save & Apply Brand Colors” and “Upload Brand Fonts” as unavailable on both Free and Pro, with unlimited brand colors, fonts and logos starting at Business. Education and Nonprofit get a limited brand kit with 10 custom fonts. A solo creator who wants brand colors cannot get them on Pro.
Templates and asset library: Thousands of templates organized by use case across infographics, presentations, reports, social media, posters, flyers, and videos. Built-in icon library with vector graphics. Stock photo integration. Custom illustrations and shapes. Honest assessment: Template library is strong specifically for data-driven and information-heavy content. For trendy social media graphics, lifestyle photography, or creative design work, the template selection is narrower than Canva’s. Piktochart‘s curation is intentionally focused on professional and data communication rather than general design.
Collaboration and sharing: Team workspace with role-based permissions. Real-time collaborative editing. Commenting on designs for review workflows. Shareable links with view or edit permissions. PDF and PNG export for distribution. PowerPoint export for delivery in standard environments. Honest assessment: Collaboration features are competent and cover most team workflows. The commenting and review features work well for stakeholder feedback. For high-frequency team design work, Figma’s collaboration is more sophisticated; for occasional team review of marketing content, Piktochart’s collaboration is genuinely adequate.
Get Piktochart Pro for Visual Content
Unlimited PNG downloads, premium templates and AI text-to-infographic features on Pro at $10/month billed annually ($120/year). Business at $17/month billed annually ($204/year) is the first tier that exports PDF and PowerPoint. Education is $39.99/year.
Piktochart Pros and Cons
Pros:
AI text-to-infographic and text-to-report features are genuinely differentiated and save significant time versus building visual content from scratch. These features work meaningfully better than general AI design tools because they’re trained specifically on data visualization and report formats.
Specialized infographic and data visualization templates outperform general design tools for information-heavy content. The template curation is genuinely focused on professional data communication rather than aesthetic flexibility.
Drag-and-drop interface is accessible to non-designers. Multiple users praise the platform’s ease of learning, with most users productive within an hour of starting.
Pro pricing at $10/month billed annually ($120/year) is reasonable for users whose primary needs match Piktochart’s specialization (infographics, data, reports), as long as PNG is the format you need.
Education at $39.99/year and Nonprofit at $60/year are genuinely generous, and both include the PDF and PowerPoint export that the $120 Pro plan does not.
PowerPoint export functionality is meaningful for users in environments where presentations must be delivered in PowerPoint format.
Brand kit functionality (colors, fonts, logos) on the Business plan supports consistent visual output for ongoing content production. Note that it is Business only; Piktochart’s comparison table marks brand colors and fonts as unavailable on Free and Pro.
Scale provides some confidence in platform stability, though the company gives two different user counts on its own pages: 34 million on the homepage and over 38 million on the login screen.
Real-time collaboration with commenting works well for team review workflows on marketing content.
Cons:
Free plan allows 2 PNG downloads, and Piktochart does not state anywhere on its pricing page whether that number resets. An allowance with no published reset period is a number you cannot plan against, so treat two exports as the floor and ask support in writing if it matters to you.
Chart label customization is limited and labels can overlap on dense datasets. For serious data visualization work with many data points, the chart capabilities feel restrictive.
Template selection for general design (social media graphics, thumbnails, lifestyle content) is narrower than Canva or VistaCreate. The platform isn’t optimized for daily social media production.
No API access means programmatic design generation isn’t possible. Operations needing automated design workflows will need other tools.
English-only platform interface limits international team adoption. Most competitors offer multiple language options.
Pro exports PNG and nothing else. If you need a print-quality PDF or an editable PowerPoint, you are on Business at $204 per member per year, which is $84 a year more than Pro for a single seat. That is the most expensive misunderstanding available on this product.
Pricing is per member, not per account, so a second seat doubles the line item. Two seats on Business billed annually is $408 a year.
Mobile experience is limited. The platform is web-first with limited optimization for mobile editing workflows.
Annual purchases are effectively final. Piktochart’s Terms of Use say “We are unable to provide refunds of any fees already paid, including but not limited to cancellations, accidental purchases, mistakes made by You, or a change of mind.” Downgrading is not self-service either; the pricing FAQ tells you to email support.
For general graphic design (social media posts, thumbnails, marketing materials), Piktochart is overspecialized. Canva delivers better value for diverse design needs at the same price point.
Real Operator Profile Recommendations
Operator profile 1: Content marketer or blogger producing SEO content with infographic needs. Piktochart Pro at $10/month billed annually ($120/year) is a genuinely good fit, provided PNG is the format you publish in. The AI text-to-infographic feature converts blog content into shareable visual assets that drive social engagement and link building. The infographic templates are better than Canva for data-heavy SEO content. The maths works if you produce 2+ infographics per month and use them for content marketing distribution. Skip Piktochart if you primarily produce social media graphics (Canva is better).
Operator profile 2: Solo entrepreneur or small business owner with occasional design needs. The free plan’s 2 PNG downloads may actually be enough if you need one or two documents and nothing more. If you need occasional design across many formats, a general-purpose tool like Canva is better value across more use cases, though I was not able to read Canva’s published pricing in this session so check it yourself. Use Piktochart Pro at $120/year only if your primary content is data-driven (financial reports, analytics dashboards, statistical presentations) and PNG output is acceptable.
Operator profile 3: Marketing team at growing ecommerce store, $50K-$300K monthly revenue. Piktochart Business at $17/month per member billed annually ($204/year each) works well if your team produces data-driven content (sales reports, performance dashboards, competitive analysis infographics) regularly. Business is also the tier where the brand kit and PDF export actually exist. Remember the per-seat structure: a three-person team is $612 a year. For mixed design needs, a general-purpose team tool may deliver better total value. Run both tools if budget allows; Piktochart for data content, Canva for general design.
Operator profile 4: Educator or training organization producing learning materials. Education Plan at $39.99 per member per year is exceptional value, and it includes the PDF and PowerPoint export that the $120 Pro plan does not. The platform’s strength in data visualization and information design fits educational content production well. Highly recommended for academic use cases where the educational pricing applies.
Operator profile 5: Nonprofit organization producing impact reports and donor communications. Piktochart publishes a dedicated Nonprofit plan at $60 per user per year, which is the one to ask for rather than paying $120 for Pro. Its nonprofit page states you are eligible with 501(c)(3) designation, as a nonprofit registered with applicable government agencies, or as a bonafide church, and that you access the pricing while logged in with a .org or .edu email address. Impact reports and donor presentations are data-heavy by nature, and the nonprofit tier includes PDF and PowerPoint export.
Operator profile 6: Marketing agency producing client deliverables. Piktochart Business plan at $17 per member per month billed annually works for agencies producing data-heavy client deliverables (analytics reports, performance dashboards, market research presentations). Business is the tier that unlocks both the brand kit and PDF export, so for client work it is effectively the entry tier rather than an upgrade. For agencies producing diverse design work across many client types, a general-purpose team suite may deliver more flexibility.
Operator profile 7: High-ticket dropshipping operator producing content for SEO and email marketing. Use Piktochart Pro at $10/month billed annually specifically for blog post infographics that improve SEO content engagement and earn natural backlinks, since a blog infographic is a PNG job and Pro covers it. If you also need a PDF capability deck for a dealer application, that is Business at $204/year, and our Piktochart alternatives guide argues you are usually better off paying a designer once for that document. The AI text-to-infographic feature converts written blog content into shareable graphics with minimal effort. For ecommerce email marketing graphics, social media posts, and product imagery, use a general design tool or the built-in email design tools in Klaviyo instead.
Building a high-ticket dropshipping business and need to pick the right product category first? Grab my free high-ticket niches list →
Piktochart Compared to Competitors
Piktochart vs Canva: Canva covers a much broader range of design use cases (social media, marketing materials, presentations, infographics, video, print) with significantly more templates and assets. Piktochart at $10/month billed annually specializes in infographics, reports, and data-driven content. I am not quoting a Canva price here because canva.com returned HTTP 403 to every automated request in this session, so check their pricing page yourself rather than trusting a number from a review. For diverse design needs, Canva delivers better value. For specialized infographic and data visualization work, Piktochart’s templates are better optimized. Many marketing teams run both tools (Canva for general design, Piktochart for data content) because the specializations are genuinely different.
Piktochart vs Visme: Their pricing page is worth reading directly. Visme publishes that it offers a free plan with paid plans starting at $12.25 per month for individuals and $24.75 per month for teams when billed annually. It offers similar specialization in presentations and data visualization with stronger interactive presentation capabilities. Visme’s animations and interactive features are more sophisticated than Piktochart’s. For presentations specifically, Visme often delivers better results. For static infographics and reports, Piktochart’s templates are typically stronger. The platforms compete directly with similar pricing; the choice depends on whether you prioritize presentations (Visme) or infographics (Piktochart).
Piktochart vs Venngage: Venngage focuses heavily on infographics and data visualization, similar to Piktochart’s specialization. I cannot publish a Venngage price because its pricing page renders plan prices in JavaScript rather than in the HTML, so read it yourself. The template selection skews more toward business reports and HR communications. For ecommerce and marketing content marketers, Piktochart‘s template variety is typically broader. For HR and internal communications, Venngage may deliver better fit. Both platforms occupy the same “specialized infographic builder” category with minor differentiation.
Piktochart vs Infogram: Infogram is more specialized in interactive data visualization with stronger chart and graph capabilities. For sophisticated data analysis and interactive dashboards, Infogram delivers more. For static infographic creation with strong template options, Piktochart works better. Infogram’s pricing page also renders its plan prices in JavaScript, so I publish no figure for it; the choice depends on whether you need interactivity (Infogram) or template variety (Piktochart).
Piktochart vs Adobe Express: Adobe Express delivers general design capability with Adobe ecosystem integration. Adobe’s pricing page would not complete a connection for me in this session, so I quote no price for it. For users already invested in Creative Cloud, Adobe Express integrates seamlessly. For specialized infographic and data work, Piktochart’s templates are more targeted. Adobe Express wins on price and ecosystem; Piktochart wins on infographic specialization.
Piktochart vs VistaCreate: VistaCreate offers a large template library and animated graphics for general-purpose design work. I did not verify VistaCreate’s current pricing or template count in this session, so treat both as unchecked. For daily social media production with animation needs, VistaCreate wins clearly. For specialized infographic and report work, Piktochart’s targeted templates deliver better results. The platforms serve different use cases despite similar pricing.
FAQ: Piktochart Common Questions
How much does Piktochart cost?
Piktochart pricing starts at $0 for the Free plan (2 PNG downloads), $10/month billed annually ($120/year) or $15/month billed monthly for Pro, and $17/month billed annually ($204/year) or $20/month billed monthly for Business. All prices are per member. Enterprise and Campus are custom quoted. Education is $39.99/year and Nonprofit is $60/year, both requiring verification. Annual billing saves up to 33% versus monthly.
Does Piktochart have a free plan?
Yes. The free plan publishes 2 PNG downloads, free templates only, 60 AI credits and 1GB storage, with no PDF or PowerPoint export. On the watermark question, Piktochart’s own comparison table ticks “No Piktochart Logo on Downloads” for every tier including Free, and offers Normal, Medium and High download quality on Free as well. The page does not say whether the 2 downloads reset, so plan on two and export a test file before relying on it.
Does Piktochart have a free trial?
The word “trial” does not appear on Piktochart’s pricing page. The Free plan is the evaluation route, and its 2 PNG downloads mean you can test the interface and template selection but cannot sustain ongoing output without upgrading.
Is Piktochart better than Canva?
Depends on your use case. Piktochart is better for infographics, data visualization, and reports. Canva is better for general design (social media, marketing materials, diverse content types). Canva has more templates and assets across more categories; Piktochart has better-optimized templates for data and information content. Many marketing teams run both tools.
Does Piktochart have AI features?
Yes. AI text-to-infographic converts written content or data into visual infographics. AI text-to-report generates report drafts from prompts. AI design suggestions during editing. Smart template recommendations based on content type. The AI features are Piktochart‘s most differentiated capability versus general design tools.
Can I export to PowerPoint from Piktochart?
Only on Business and above. Piktochart’s comparison table gives Download Formats as PNG for Free, PNG for Pro, and PNG, PDF, PowerPoint for Business, Education and Nonprofit. So the $120/year Pro plan cannot export PowerPoint or PDF, and neither can Free. If PowerPoint or a print-quality PDF is the reason you are buying, Business at $204/year is the entry tier.
Does Piktochart have an API?
No. Piktochart does not offer an API. Programmatic design generation isn’t possible through the platform. Operations needing automated design workflows will need other tools or custom integrations through Zapier or similar middleware.
What languages does Piktochart support?
The platform interface is English only. Multi-language support for design content (creating designs in non-English languages) works through font support, but the platform UI itself doesn’t offer language alternatives. International teams may find this limiting.
Is Piktochart good for small businesses?
Depends on your design needs. For small businesses producing data-heavy content (reports, infographics, analytics presentations), Piktochart Pro at $120/year delivers value if PNG suits you, and Business at $204/year if you need PDF. For small businesses with diverse design needs across social media, marketing and presentations, a general-purpose tool typically delivers better total value across more use cases.
How does Piktochart pricing compare to Canva?
Piktochart Pro is $10/month billed annually ($120/year) or $15/month billed monthly. I am not publishing a Canva figure because canva.com returned HTTP 403 to every request I made in this session, so read their pricing page directly. The total value differs based on use cases: Canva covers more design types; Piktochart specializes deeper in fewer types. Match the tool to your primary content type rather than choosing on price, and remember that Piktochart Pro exports PNG only.
Can I use Piktochart for social media graphics?
Yes, but Canva or VistaCreate typically deliver better results for social media work. Piktochart’s templates are optimized for infographics and data content rather than trendy social media graphics. For occasional social media use alongside primary infographic work, Piktochart works adequately. For primary social media production, dedicated tools are better.
Is Piktochart worth the price?
Worth it for content marketers, educators, and analysts producing data-driven visual content regularly. The AI text-to-infographic and text-to-report features deliver genuine productivity gains for these use cases. Not worth it for general design needs where Canva or VistaCreate cover the same use cases more affordably. Match the tool to your specific content production workflow.
Final Verdict on Piktochart
Piktochart is a legitimately useful specialized visual content creation platform that delivers real value for content marketers, educators, analysts, and nonprofit communicators producing data-driven visual content regularly. The platform’s strengths are genuine: specialized infographic and report templates that outperform general design tools for information-heavy content, AI text-to-infographic and text-to-report features that save meaningful time versus building from scratch, drag-and-drop interface accessible to non-designers, a genuinely cheap education tier at $39.99 per member per year, and reasonable Pro pricing at $10/month billed annually.
The platform’s weaknesses are equally real. The Pro tier exports PNG only, so the plan most people buy cannot produce the PDF a supplier or a client actually asked for, and brand colors and fonts do not appear until Business either. Chart customization is limited for sophisticated data visualization work. Template selection is narrower than Canva for general design needs. No API limits programmatic workflows. English-only interface limits international adoption. The platform is overspecialized for users who need diverse design capabilities rather than focused infographic and data work.
For content marketers specifically, Piktochart Pro at $120/year is a genuinely good investment if you produce 2+ infographics or data-driven visual assets per month and use them for SEO, social engagement, or stakeholder communications. The AI text-to-infographic feature alone often justifies the subscription cost by converting written blog content into shareable visual assets in minutes rather than hours.
For ecommerce operators specifically, the recommendation depends on your content marketing strategy. If you produce blog content with infographic complements for SEO, Piktochart Pro fits well alongside your Omnisend or other email marketing platform. If you primarily produce product images, social media content, and email graphics, a general-purpose design tool covers more of your needs. Run Piktochart specifically when data visualization and infographic creation are core operational needs.
For high-ticket dropshipping operators specifically (Trevor’s coaching audience), Piktochart can be useful for SEO content marketing where infographics improve blog post engagement and earn natural backlinks from data-heavy original content. The platform isn’t essential to high-ticket operations the way email marketing or product photography is, but it’s a useful tool for content marketers building authoritative blog content that ranks for high-ticket keywords. Consider it after you’ve established the email marketing and content fundamentals; don’t prioritize it over more revenue-impactful tools.
The platform decision is meaningful but not strategic. The strategic decisions start with picking the right high-ticket niche. Next comes finding real US brand suppliers who’ll approve your store.
After that it is getting your legal foundation built properly. Then it is executing on the high-ticket dropshipping fundamentals, none of which depend on which design tool you picked.
According to Piktochart’s official pricing page, paid tiers include unlimited downloads and annual billing saves up to 33% off monthly pricing. The same page publishes Education at $39.99 per member per year, and Piktochart’s nonprofit page publishes $60 per user per year for registered nonprofits. Every figure in this review was read on Piktochart’s own live pages on 16 September 2026.
Ultimately, Piktochart delivers on its specialization promise for users whose primary visual content needs match the platform’s data and information focus. For users with broader design needs, general-purpose tools typically deliver better total value. Match the tool to your content production workflow rather than choosing based on brand recognition or template counts.
Start Creating with Piktochart
Visual content creation specialized for infographics, data-driven presentations, reports, and explainer graphics. AI text-to-infographic and text-to-report features. Free plan available; Pro at $10/month billed annually. Education at $39.99/year for verified students and educators.
Want my team to handle the entire ecommerce store setup, content strategy, and visual content production for your high-ticket store? Get a fully-loaded ecommerce business with US brand suppliers approved, products loaded, content strategy built around real keyword research, and content production ready to launch. Get a done-for-you high-ticket store →

Trevor Fenner is an ecommerce entrepreneur and the founder of Ecommerce Paradise, a platform focused on helping entrepreneurs build and scale profitable high-ticket ecommerce and dropshipping businesses. With over a decade of hands-on experience, Trevor specializes in high-ticket dropshipping strategy, niche and product selection, supplier recruiting and onboarding, Google & Bing Shopping ads, ecommerce SEO, and systems-driven automation and scaling. Through Ecommerce Paradise, he provides free education via in-depth guides like How to Start High-Ticket Dropshipping, advanced training through the High-Ticket Dropshipping Masterclass, and fully done-for-you turnkey ecommerce services for entrepreneurs who want a faster, more hands-off path to growth. Trevor is known for emphasizing sustainable, real-world ecommerce models over hype-driven tactics, helping store owners build scalable, sellable, and location-independent brands.
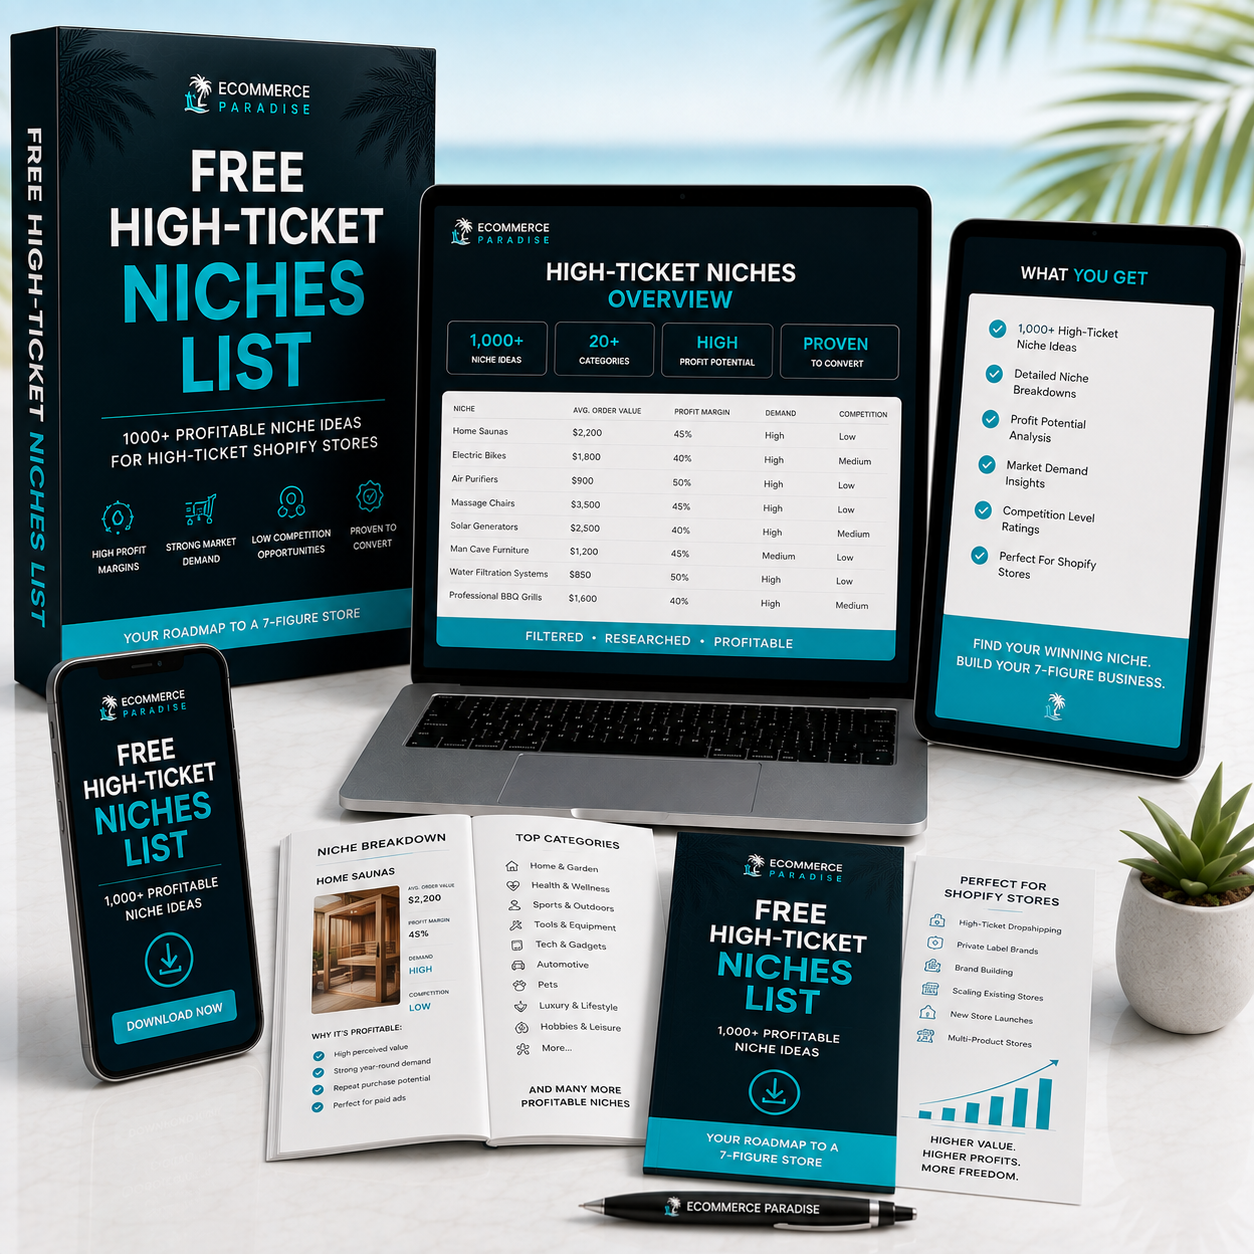
Still deciding what to sell?
Grab the free list of 1,000+ niches that work for high-ticket dropshipping, sorted by category.
Free. Unsubscribe any time.


